Georgia Milestones Score Trends: Pre- and Post-COVID Trajectories
Five years after the initial pandemic disruption, Georgia Milestones assessment data tells two very different stories. Math has largely recovered to pre-pandemic performance levels. Literacy has not.
For district administrators, assessment directors, and instructional leaders, that distinction matters. The data no longer supports treating COVID recovery as a single narrative. Math and ELA are now on different trajectories, requiring different intervention strategies, different resource conversations, and different expectations moving forward. The question is why approaches that appear to be working in math are not producing the same results in literacy.
What Does the Data Actually Tell Us?
The Math and ELA Divergence
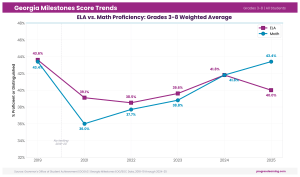
After analyzing Milestones scores from before COVID up to 2025, the headline numbers tell the story clearly.
Math proficiency across grades 3-8 has fully returned to its pre-pandemic baseline, moving from 43.4% in 2018-19 back to 43.4% in 2024-25. ELA however has not recovered, falling from 43.6% proficiency to 40.0% over the same period. At the high school level, every End-of-Course (EOC) subject remains below 2019 proficiency levels.
These are not two versions of the same problem. They are two distinct intervention challenges requiring different intervention strategies and resource decisions.
Deeper Data Details: Trends and Subgroup Impact
The 2024-25 ELA Reversal
The most concerning development in the latest data is that the fragile ELA recovery many districts had been pointing to officially broke during the 2024-25 school year. This is not a plateau. It is a reversal. ELA proficiency declined in four of the six tested grades:
- Grade 3 fell to 35.1%, its lowest point since the first post-pandemic testing cycle
- Grade 5 dropped back after showing improvement the previous year
- Grade 8 experienced one of the sharpest declines, falling nearly five percentage points in a single year
- Only Grades 4 and 7 showed improvement.
While new ELA standards are being implemented in 2025-26, this downward trend began before those changes took effect. The instructional adjustments that appeared to be working from 2021-22 through 2023-24 are no longer producing the same results.
Beginning Learners: The Most Actionable Metric
The students in the “Beginning Learners” represent the lowest performance tier and ultimately determine the amount of intervention, remediation, and support a district must provide.
Why should district leaders focus on Beginning Learners?
- They represent students with the greatest intervention needs
- They drive staffing and resource allocation decisions
- They determine the true scale of remediation required
Across Georgia, ELA Beginning Learner rates increased in every tested grade compared to pre-pandemic levels. In several grades, the increase ranged from six to nine percentage points.
If your district’s share of Beginning Learners has grown by that amount, your 2019 intervention capacity is likely no longer sufficient. This has evolved into a resource planning challenge, not just an instructional challenge.
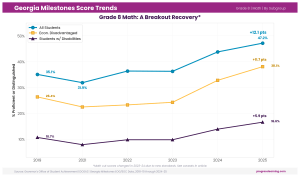
Math presents a more encouraging picture. Grade 8 Beginning Learner rates declined significantly, providing evidence that math remediation efforts are producing measurable results. However, rates remain elevated in some grades and warrant continued attention.

Subgroup Impact Profiles
Economically Disadvantaged Students
The data presents a clear challenge for Federal Programs Directors and district leaders responsible for Title I planning. Key findings for economically disadvantaged students include:
- ELA Beginning Learner rates increased significantly
- Grade 3 climbed from 34.3% to 41.7%, meaning more than four out of ten students are performing at the lowest tier
- ELA proficiency declined in four of six tested grades
- Math proficiency increased in five of six tested grades
- Grade 8 math improved by 11.7 percentage points, one of the strongest gains in the dataset
As districts evaluate future Title I investments, the data suggests that literacy intervention deserves urgent attention while successful math recovery strategies should continue.
Students with Disabilities (SWD)
For students with disabilities, the results highlight a clear contrast between literacy and math outcomes:
ELA
- Performance remained essentially unchanged compared to 2019
- Literacy interventions have produced limited measurable improvement
Math
- Average proficiency increased from 15.3% to 16.9%
- Grades 5 and 8 showed the strongest gains
- Tier 2 and Tier 3 interventions appear to be producing measurable results
While the gains are modest, the contrast suggests districts should closely evaluate the effectiveness of their literacy intervention frameworks.
EOG and EOC Highlights
Several trends stand out across the elementary, middle, and high school data:
- Grade 7 was the only ELA grade level to exceed pre-pandemic performance
- Grade 3 remains a major literacy concern and aligns closely with the goals of Georgia’s Early Literacy Act
- Grade 8 experienced the largest ELA decline among tested grades
- Grade 5 and Grade 8 math exceeded 2019 proficiency levels
- Grade 5 Science successfully recovered
- Grade 8 Science continues to struggle, with a large percentage of students performing at the Beginning Learner level
- U.S. History remains the weakest-performing high school recovery area and has remained largely flat since recovery began
At the high school level, American Literature, Biology, and U.S. History all remain below pre-pandemic performance.
Because success in subjects like American Literature and U.S. History depends heavily on reading comprehension and source analysis, these results point to a broader content-area literacy challenge rather than an ELA-only issue.
The Grade 8 Math Anomaly
The biggest standout grade and subject combination is the success story from 8th grade math. Proficiency increased more than 12 percentage points, rising from 35.1% to 47.2%. Similar gains occurred among economically disadvantaged students and students with disabilities.
The gains likely reflect both the cumulative impact of several years of targeted math intervention and changes associated with standards realignment and assessment updates. However, the simultaneous decline in Beginning Learners suggests that genuine student growth occurred.
The Implementation Gap
From a COVID Slide to a COVID Floor
For literacy, the temporary COVID slide appears to have become a COVID floor.
Classroom instruction alone is not closing foundational reading gaps for students whose earliest school years were disrupted by the pandemic. The students most affected by those disruptions are now entering middle school and high school, where achievement gaps become significantly harder to address.
The Middle and High School Pipeline Problem
A student who was a first grader in 2020 is now entering seventh grade. A third grader from 2020 is now entering high school.
The literacy challenges visible in elementary school data are now showing up in middle school and high school outcomes. American Literature and U.S. History performance suggests these gaps are not resolving naturally as students age.
The persistent struggles in U.S. History are particularly telling. Success on that assessment depends heavily on reading comprehension, source analysis, and evidence-based reasoning, making it a big literacy indicator as well a content area assessment.
What Can Schools and Districts Do?
One challenge districts consistently face is turning assessment data into meaningful action. Identifying learning gaps is important, but identifying gaps alone does not improve outcomes.
By connecting assessment results directly to intervention and remediation resources, schools can respond more quickly to student needs while reducing manual work for teachers. Progress Learning helps schools connect assessment, intervention, remediation, and progress monitoring into a single workflow.
Through Georgia standards-aligned assessments, educators can identify learning gaps tied directly to standards. Quick Click Remediation connects assessment results to targeted instructional resources, while Liftoff adaptive intervention automatically creates individualized learning pathways for students in grades 2-8. This allows schools to expand intervention capacity without increasing the manual workload placed on teachers.
Independent research has also demonstrated positive results. A Johns Hopkins University study conducted in Douglas County, Georgia found that Progress Learning users achieved significant positive impacts in math achievement and positive trends in ELA performance.
Georgia schools also have access to:
- Pre-built “unit assessments” that assess students’ proficiency by content domain through Progress Learning’s acquisition of Lennections
- Pre-built Georgia Milestones-style practice assessments that mirror the end of year tests in both content and format
- Progress monitoring and reporting tools that track performance across standards
In Northwest Laurens Elementary, one Georgia educator used Progress Learning to help drive a 21.4-point science proficiency gain in a single year!
The students most affected by pandemic disruptions are now moving into the grades where intervention becomes increasingly difficult. For district leaders, the question is no longer whether intervention is needed. The question is whether current intervention systems are built to address the literacy challenges that Georgia schools continue to face today. Get in touch below to see how Progress Learning can support all students in your district.